See what matters most
Dashboard is your landing page with a mix of security and maintenance information. You can see at first glance the most important issues that happened in the environment within a specified time period and might need your attention. Here you will also find links to Safetica installer and more useful info about how to work with Safetica.
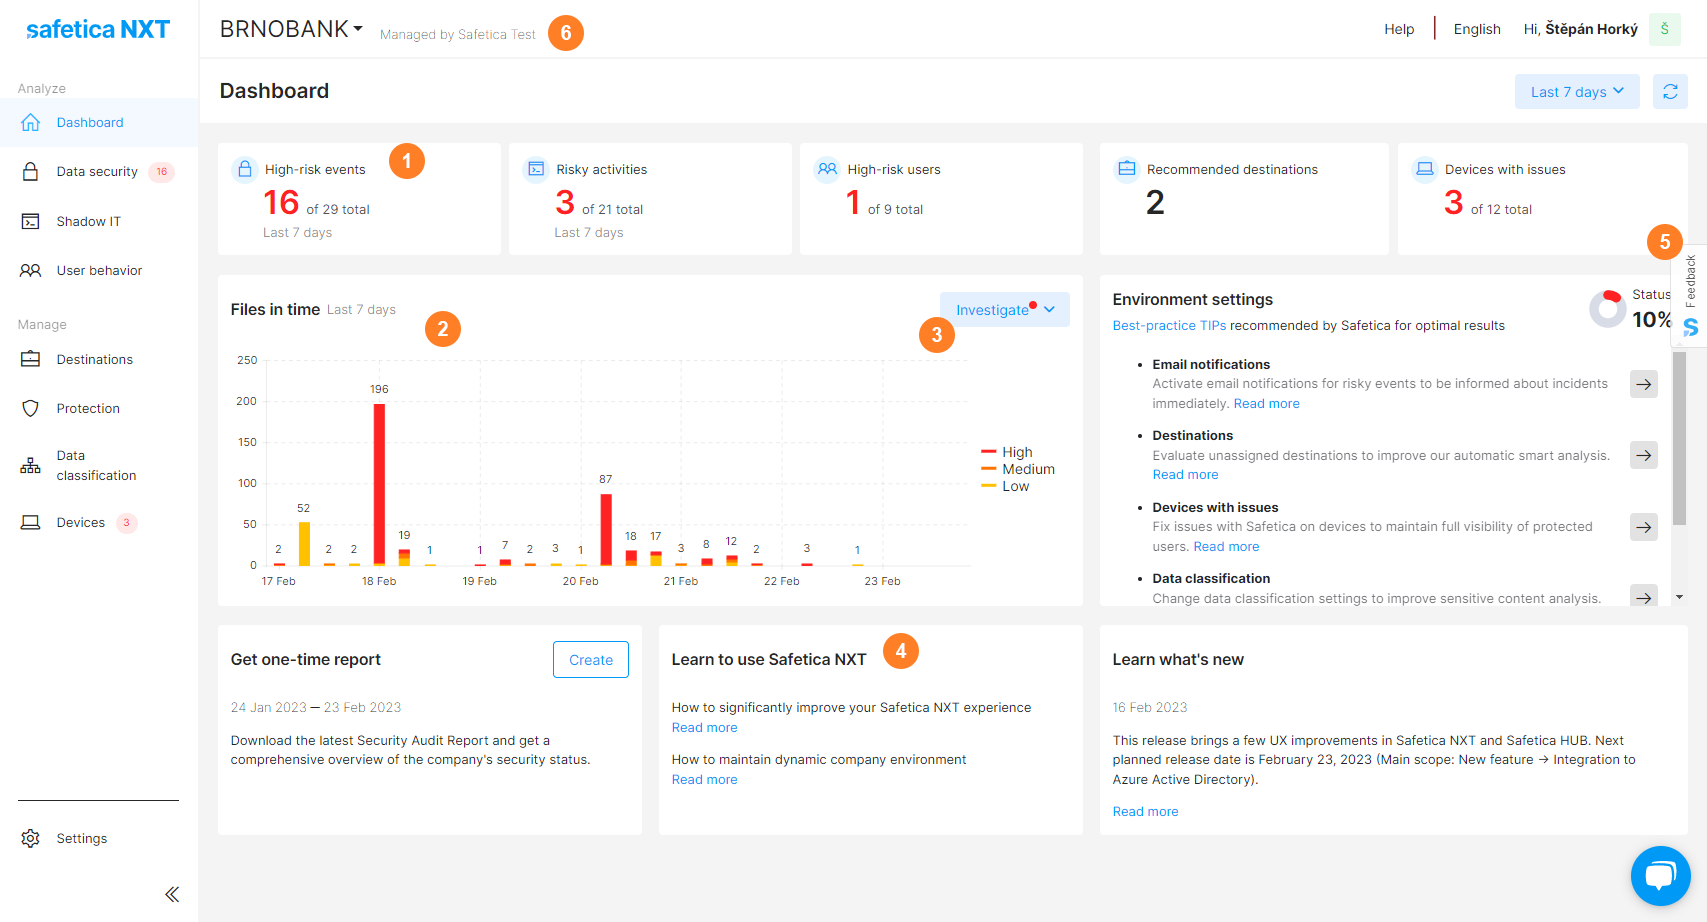
In Dashboard, you can:
![]() see a clear overview of the most vital info from Safetica NXT, so you can quickly grasp the situation and take appropriate action. Click the tiles to see the respective risky events or changes in your Workspace.
see a clear overview of the most vital info from Safetica NXT, so you can quickly grasp the situation and take appropriate action. Click the tiles to see the respective risky events or changes in your Workspace.
![]() immediately see all types of risky events, and how the number of total and risky events changed in time.
immediately see all types of risky events, and how the number of total and risky events changed in time.
Click the tiles to go to the individual sections of Safetica NXT and see more details.
![]() investigate various scenarios in the Files in time chart. Investigations with new risky events are highlighted in red.
investigate various scenarios in the Files in time chart. Investigations with new risky events are highlighted in red.
You can investigate important issues by using either our default filters or your own custom filters.
![]() read Knowledge Base articles for important features and see what new stuff is included in the latest version
read Knowledge Base articles for important features and see what new stuff is included in the latest version
![]() send us feedback or open Safetica NXT Help
send us feedback or open Safetica NXT Help
![]() if the customer has active managed mode (i.e. they have an MSP partner that provides them support), they will see the partner's name in the page header.
if the customer has active managed mode (i.e. they have an MSP partner that provides them support), they will see the partner's name in the page header.