See the context of files that leave your company.
Users perform hundreds of data-related events every day. Safetica NXT uses various pieces of information to find among them potential data leaks and highlight these events as risky events. In Data security, you can see incidents (high-risk and medium-risk events) and all events that happened on protected devices at first sight.
In Data security, you can:
- See what events happened in your company
- Dive into event details
- Teach Safetica what is considered high-risk in your company
- Filter records and create investigations
- Create policies from events
- Export events into a .xlsx file
- Work with aggregated events
See what events happened in your company
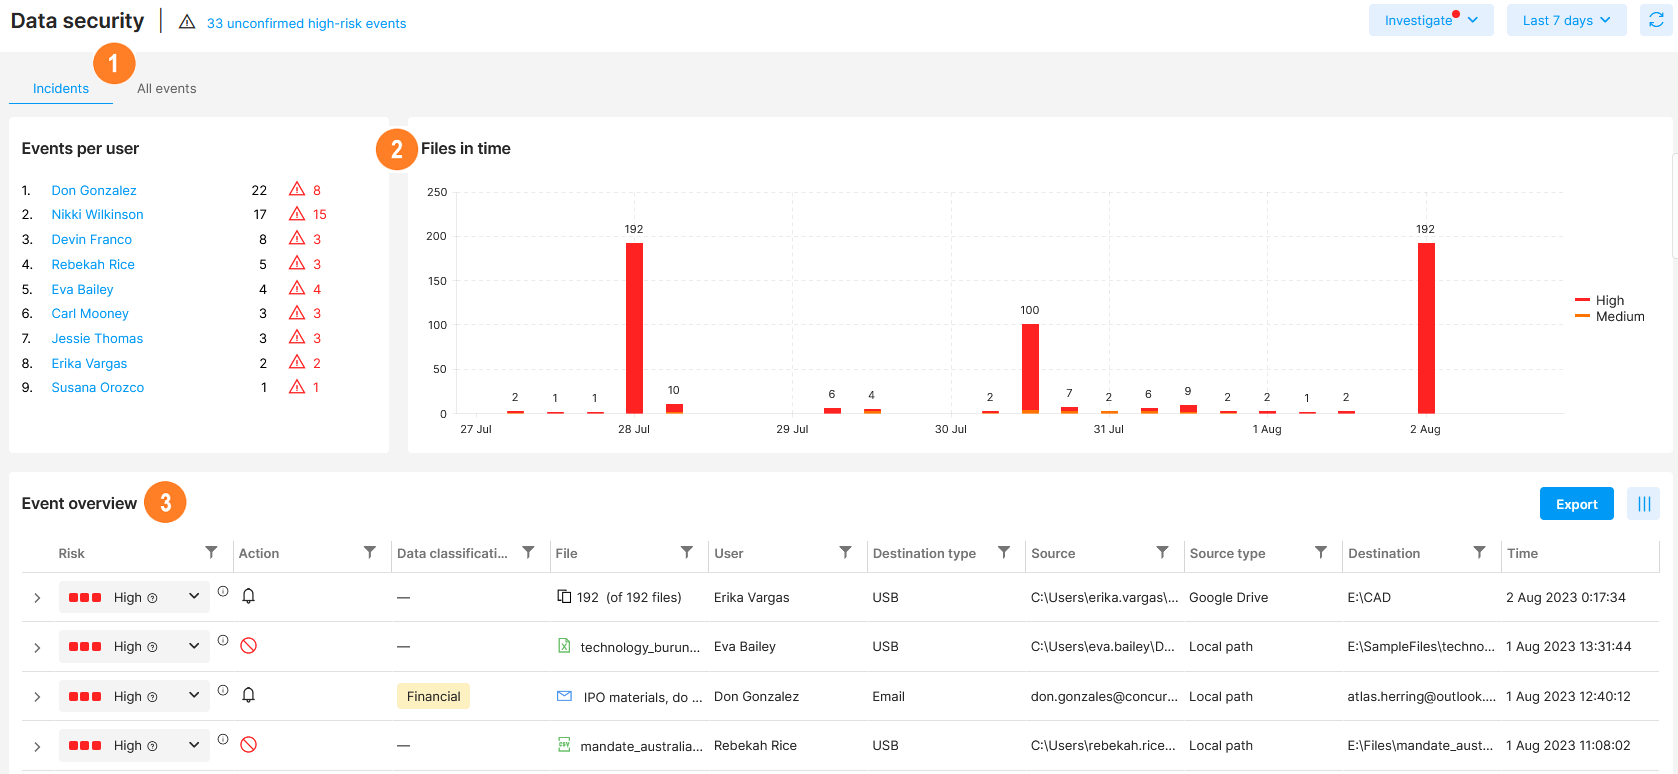
![]() The view is divided between Incidents (high-risk and medium-risk events) and All events that happened in the selected time period regardless of risk.
The view is divided between Incidents (high-risk and medium-risk events) and All events that happened in the selected time period regardless of risk.
![]() Widgets:
Widgets:
- Events per user – overview of users involved in the highest number of events and how many of them were risky (red number). Click the red number to quickly view high-risk events initiated by that particular user.
- Files in time – see how the number of high and medium-risk events changed in time. You can click the bars to drill down a bit further.
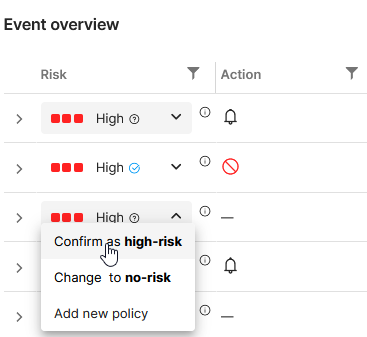
![]() Event overview:
Event overview:
- Click
 to confirm or change the risk of an individual event or create a new policy from the event.
 - Hover the mouse over the
 icon to see the reasons why the event was evaluated as risky.
 - See the Sensitive data column to discover files that contained sensitive content. To see why an event was assigned a certain data classification, hover the mouse over the particular content label.
- See what protective action (log event
 , block event
  , or notify user
  ) was performed by the policy on the device.
 - See many other details about events
Dive into event details
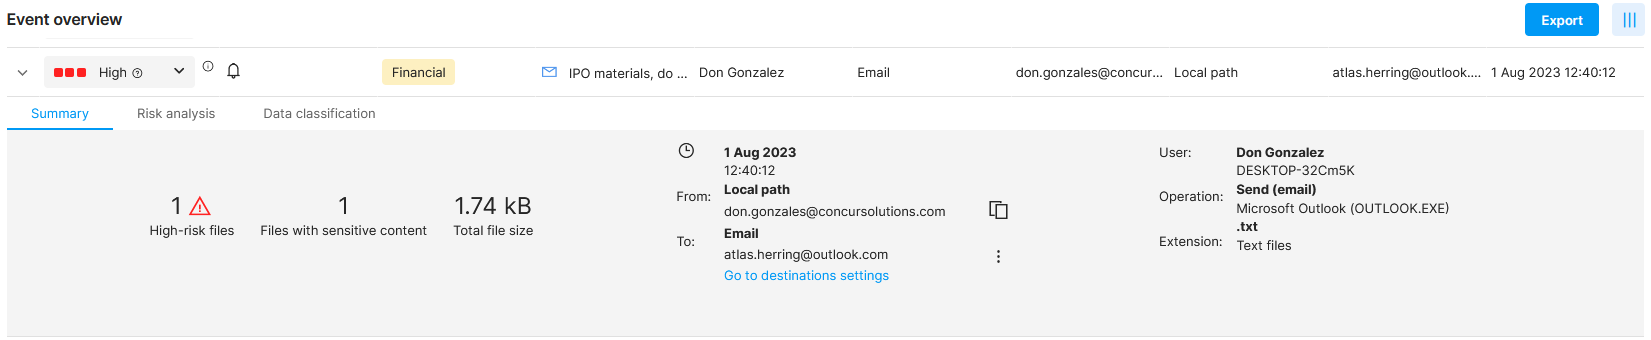
Open the details of an event by clicking the little arrow on the left. You will see several tabs:
Summary - detailed information about the event, such as file, size, time, user, destination, etc. From this tab, you can also add the destination to safe or untrusted destinations.
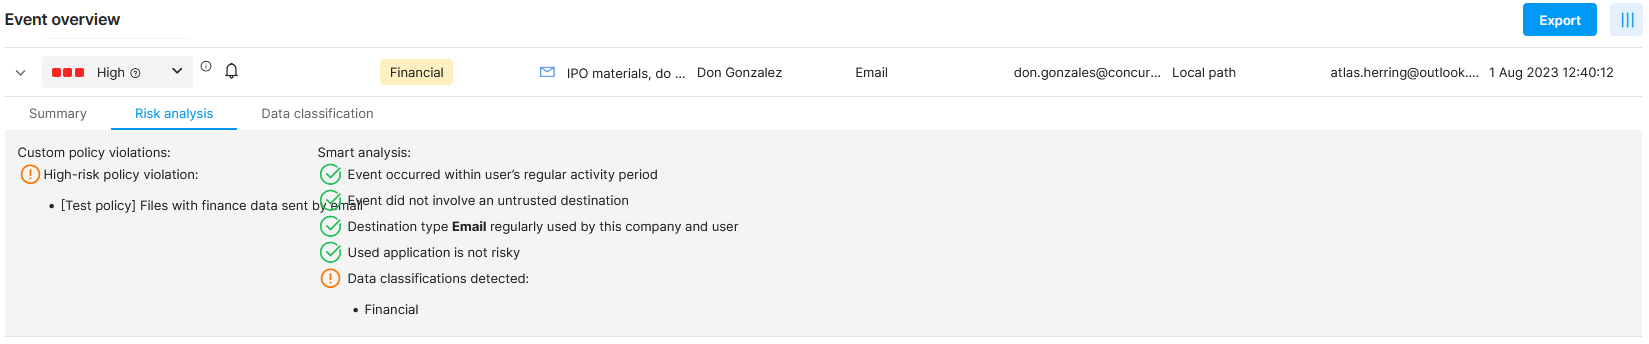
Risk analysis - the results of our smart analysis and policies. You can see exactly which policies were violated by the event.
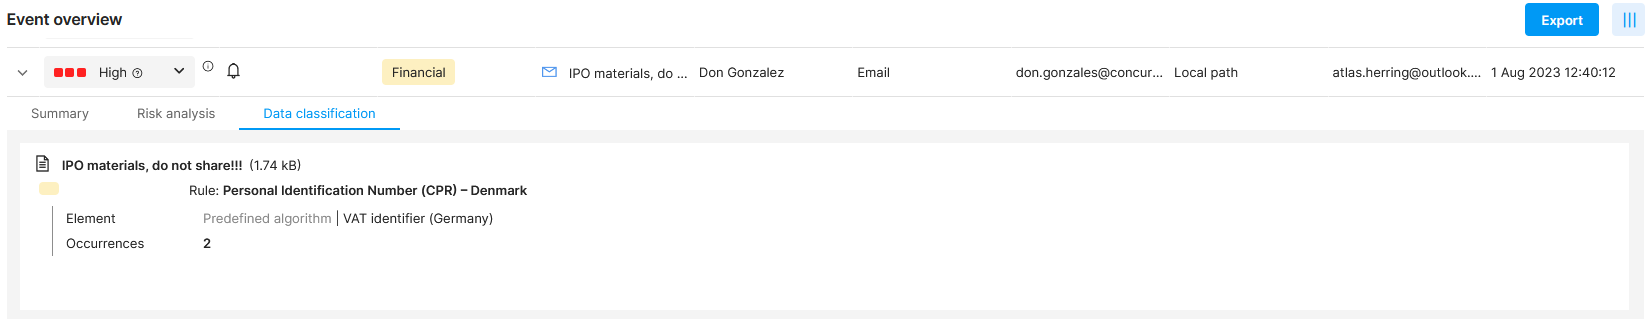
Data classification - all sensitive information and their data classifications that were detected within the event.
Teach Safetica what is considered high-risk in your company
Confirming whether detected events are really high-risk helps Safetica NXT to learn what is considered risky in your company and what is not. This will simplify your work with Safetica and improve its automated behavior.
- Click the Unconfirmed high-risk events link in the upper part of the page.
- This will filter out all the high-risk events for which you did not confirm their risk.
- Click the
 icon to either confirm the event as high-risk or assign it no risk at all.
Work with aggregated events
Aggregated events are bulk operations with several files transferred at once (e.g. many files copied to USB or an email sent with several attachments).
To see all aggregated events, click the File column header. Aggregated events will be displayed at the top of the table.
Individual files that were part of the mass transfer are listed in the All files tab in the event detail. When you use a filter, individual operations within aggregated events are filtered as well, so only the ones that match the filter are displayed.
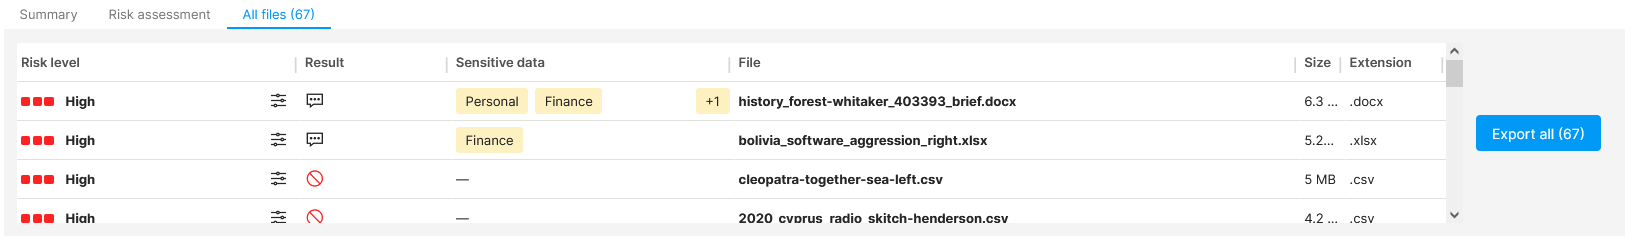
The All files tab shows a maximum of 20 files. The remaining files are hidden and can be either filtered out or exported.
How to export records about files from an aggregated event
Click the Export all button in the event detail to export records related to a specific aggregated event into an .xlsx file.
Differences from individual events
There are several differences in how info is shown for aggregated events in the Event overview table:
- File - shows the total number of files within the aggregated event and also the number of files that match the selected filter.
- Size - shows the total size of the whole aggregated event (the sum of all file sizes).